Download the White Paper and get INSPIRED
Learn how you can boost digital transformation in your organization by focussing on people, rather than technology.
Last updated: June 19th 2022
The early warning system and VIKTOR
VIKTOR has designed an early warning system that gives off a direct warning when there is a risk of bridge swelling. This way the bridge can automatically be cooled, so that no problems arise. The warning system is not only applicable to the Binnenhavenbrug, but to many other projects as well. Furthermore, it also contributes to the realisation of making Rotterdam a Smart City! And our role? The constant live reading of the bridge's temperature and automatic calculations of the effect on the structure in order to predict when the bridge gets too hot and will get stuck.
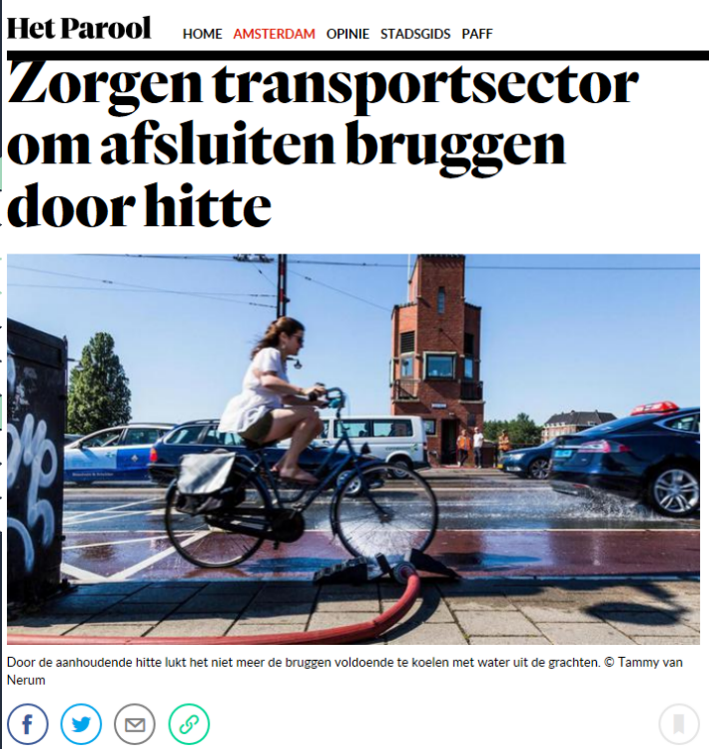
In English: Worries transport sector about closing bridges due to high temperatures
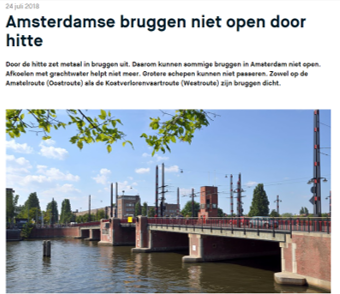
In English: Bridges in Amsterdam won't open due to heat
How does it work?
The working principle
First, temperature measurements are collected within the web-based VIKTOR platform. Then a finite element model is used to simulate the expansion for the available measurements. After that, the simulation results are calibrated with measurements of the actual bridge length and using that information, the temperature measurements are used to calculate the dilation of the bridge. The behavior of the system can be combined with current weather forecasts to predict the bridge's behavior in the future as well.
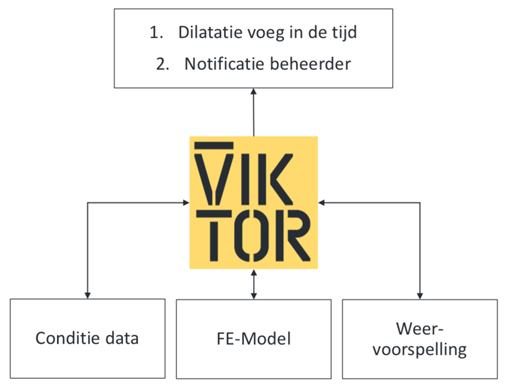
Working principle of the early warning system
Temperature sensors
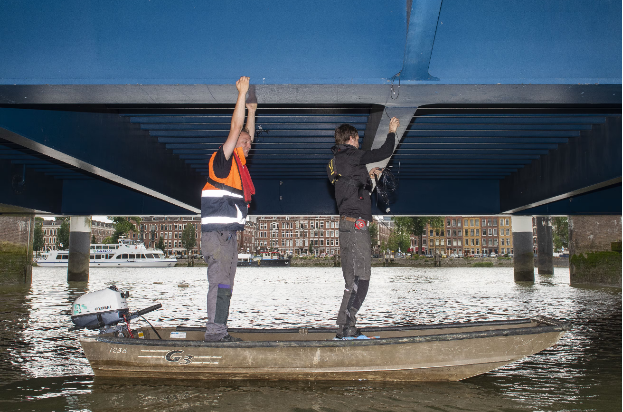
A total of 52 sensors supply data about the temperature distribution of the bridge and a measurement is performed every 15 minutes. The results hereof are immediately available on the online platform. The sensors are distributed over the different parts of the bridge, being the deck, sides, primary stiffeners, and secondary stiffeners.
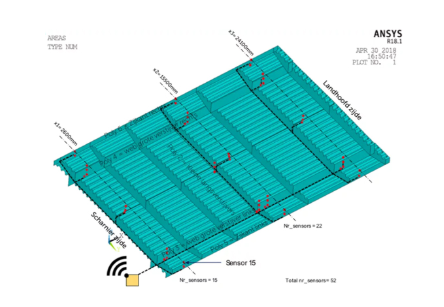
Placement of the temperature sensors
Temperature modeling
Ansys software is used to create a finite element model of the bridge. This model uses the surface polynomials to determine the temperature distribution in the structure. The animation below shows the temperature of the deck on 1 August between 10:00-15:00.
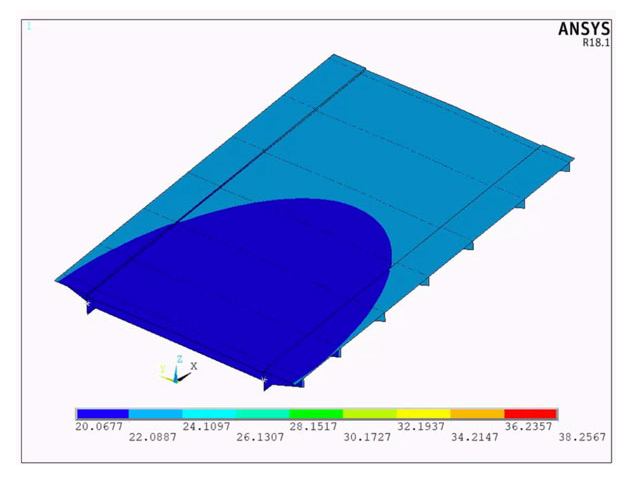
The temperature on the deck on 1 August between 10:00-15:00
Expulsion simulations
Differences in temperature cause the bridge to warp. The first figure shows the expansion of the left and right. The differences in expansion show clear similarities with the measured temperature differences in the bridge. The second figure shows the relationship between the average temperature and the average expansion. The directional coefficient of the linear relationship can be interpreted as the thermal expansion coefficient of the bridge.
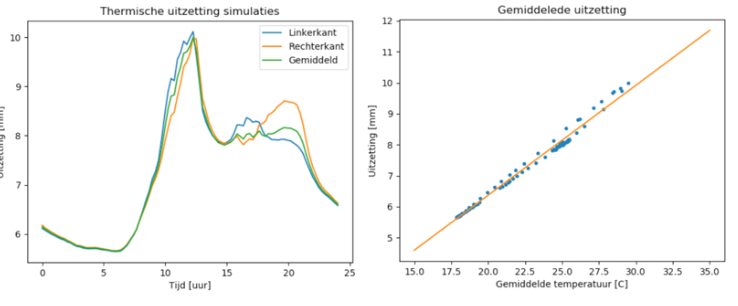
The expansion of the left and right
 The relationship between the average temperature and the average expansion
Expulsion prediction
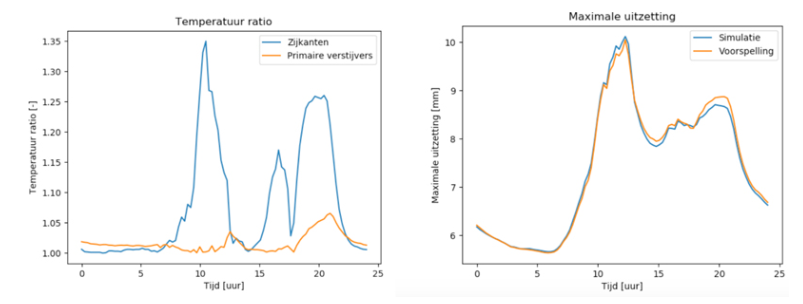
The ratios of the temperatures of the sides and the primary stiffeners are used to predict the degree of warping. An empirical relationship is defined that gives the maximum expansion: δ𝑚𝑎𝑥 = δ𝑎𝑣𝑔 ∙ (𝑟𝑎𝑡𝑖𝑜𝑤𝑒𝑏𝑠 ∙ 𝑐1 + 𝑟𝑎𝑡𝑖𝑜𝑠𝑖𝑑𝑒 ∙ 1 – 𝑐1) 𝑐2. The coefficients are chosen so that the margin of error is minimized. The figure below shows the results of the simulations and the predictions of the empirical relationship. The maximum deviation is 0.2 mm.
The results of the simulations and the predictions of the empirical relationship
System adjustments
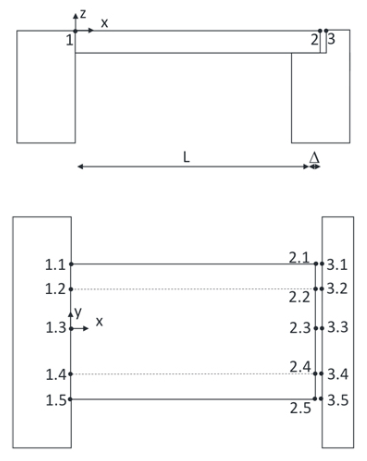
Before the system can be used to predict the dilatation joint, the system will have to be calibrated. The predicted expansions must be defined in relation to a reference temperature, reference length and reference dilatation joint. The measurements of the distances between the abutments and the dilatation joint are combined to determine these values. These values are measured at five different points to determine the accuracy of the warp prediction.
System operation
After the system has been calibrated, the current temperature measurements can be translated into a minimal dilatation gap. The degree of change can be used to give a timely warning. Now the combination of temperature measurements and weather data can be used to predict an expected dilatation gap based on a weather forecast!
Successful conclusion
The measurements bring a structural solution within reach. Even during the hottest days, the bridge remained working perfectly thanks to the 52 warmth sensors. Based on the measurements, at the end of June, the bridge deck was shortened a bit. This measure appeared to be successful and made cooling the bridge unnecessary, and traffic disruptions no longer occur.
It is great to see that all the experience that has now been gained with the Binnenhaven bridge will be included in the approach to other bridges with heat problems in Rotterdam as well!
"You can see under which circumstances the problem arises but also what the effect of the countermeasures is. That helps contribute to finding an affordable, data-centered solution". - Peter Madlener, CCO VIKTOR


