
Download the White Paper and get INSPIRED
Learn about trends in digital transformation and how they affect the engineering and construction industry.
There is potential room for improvement:
- Create multiple boreholes in a single table.
- Assign soil properties to each layer automatically.
- Capability to use repeated soil properties. Of course, this can also be achieved with PLAXIS built-in “.matXdb” to store material database. However, Excel format allows more flexibility to change material properties as per project, as well as having the possibility to link to another master spreadsheet.
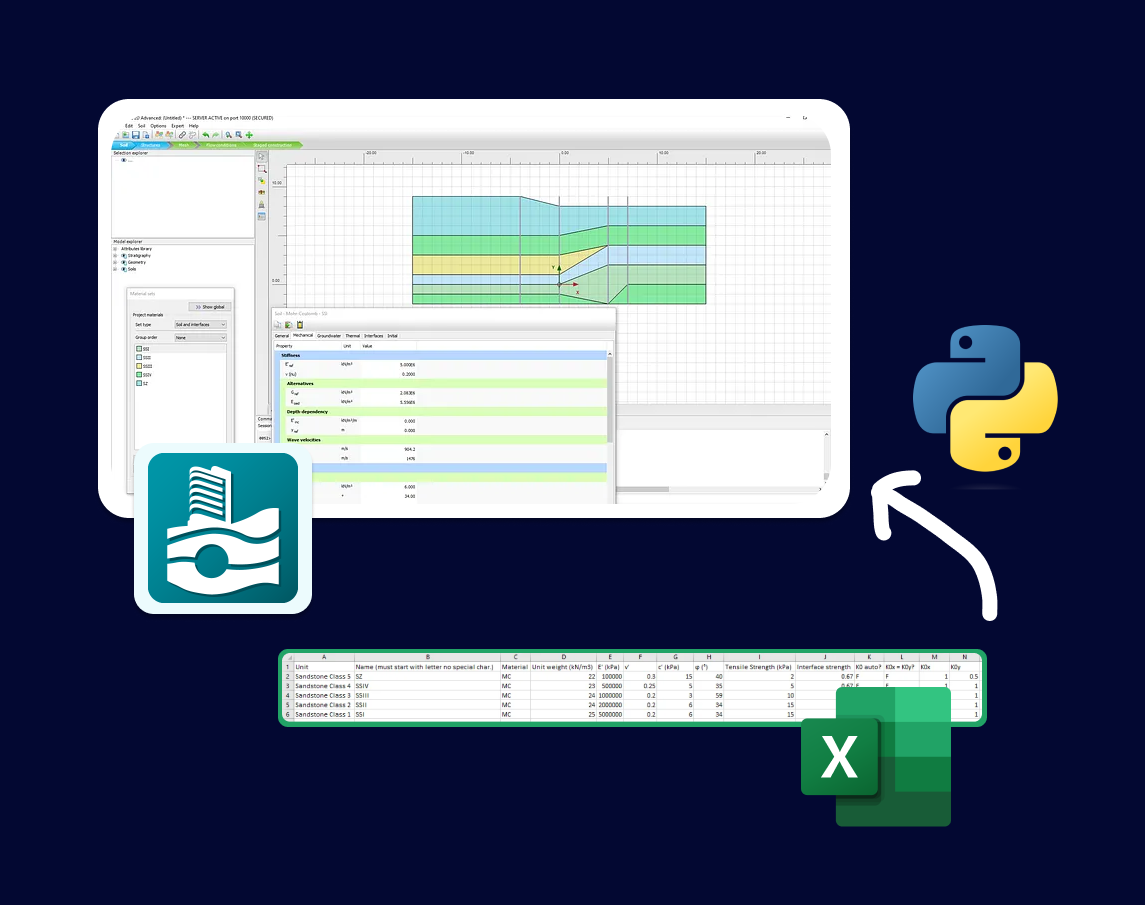
This tutorial aims to extend the lesson learned from the 4th tutorial. We will further develop our Excel interface to define soil profiles and assign soil properties in PLAXIS.
- Read values from Excel using Pandas
- Input soil depth with Excel and create soil profile
- Input soil properties with Excel and assign material
As before, this tutorial requires the readers have VS Code and PLAXIS environment installed. If you have not, follow the instructions in the blog Start Using Python to Automate PLAXIS
Also, we will also need pandas installed to the PLAXIS environment. If you haven’t done so, follow the instructions in the blog PLAXIS output visualization using Python
Prepare Your Excel Input Interface
Similar to the 4th tutorial, we want to create an Excel input template and create soil profiles in PLAXIS.
We will create an empty excel spreadsheet, call it “Soil_input”. The interface contains two worksheets:
- OHE Ground Profile
- Soil properties
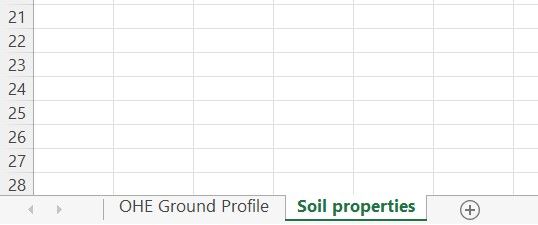
When you create the worksheets, ensure they follow the same names as shown above as the naming is case-sensitive.
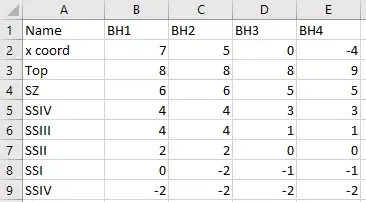
OHE Ground Profile
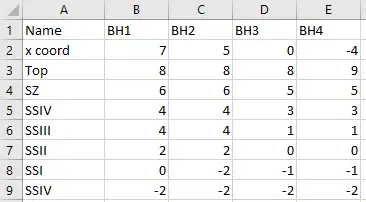
The purpose of the “OHE Ground Profile” worksheet is to define the name and depth of soil units. These values will be used to create corresponding boreholes in PLAXIS. It involves four input values as shown below:
-
Name: specify the name of each borehole. This row will not be extracted in Python but it’s a good tracker of which boreholes we are working on. For example, column B contains all the input values for “BH1”.
-
x coord: define the x coordinate of each borehole.
-
Top: define the y coordinate at the top of each borehole. In other words, the top R.L. in terms of geotechnical engineering.
-
Soil unit name & layer coordinates: starting from row 4, we will first define the name of soil unit name in column A. Then we input the bottom y coordinate of each unit under each borehole.
It should be emphasised that this template is designed to input the bottom coordinate of each unit. Another important note is that we should input all the units across all the boreholes in column A. Similar to the logic of PLAXIS interface, if we encounter a unit which doesn’t exist in a borehole, we put the same y coordinate as the previous unit.
Take “BH1” as an example, we put 4 m for both “SSIV” and “SSIII”, which means “SSIII” doesn’t exist in “BH1”.
Soil properties
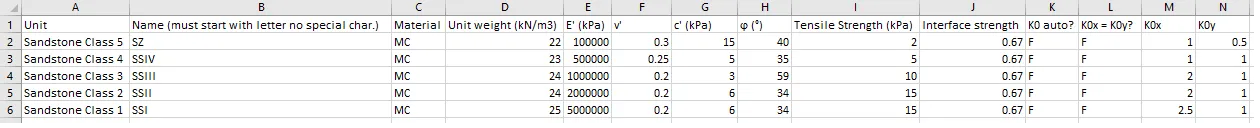
The purpose of this worksheet is to define the soil properties of each unit. This contains the following columns:
- Name
- Material
- Unit weight (kN/m3)
- Young’s Modulus, E’ (kPa)
- Poisson ratio, v (nu) (-)
- Cohesion, c’ (kPa)
- Friction angle, phi (degree)
- Tensile strength (kPa)
- Interface strength (-)
- K0 auto?: T/F which determines if K0 is calculated automatically in PLAXIS
- K0x = K0y?: T/F to determine if K0x is equivalent to K0y
- K0x (-)
- K0y(-)

These are typical material properties for Mohr-Coulomb model in PLAXIS 2D, just to ensure all input properties are in the correct unit. It should also be noted that this template is only designed for Drained condition.
Make sure you have created the excel spreadsheet with the worksheets and values as outlined above.
Once the input file is created, we are ready to move to the next step.
Start automating your workflows
Step 1: Read Values from Excel Using Pandas
The main goal of Step 1 is to set the soil contour and read the excel input template.
First, we create an empty python file and call it “soil_geometry.py”.
Import Modules and Start Server
Similar to previous tutorial, we will start off by importing relevant modules and start server.
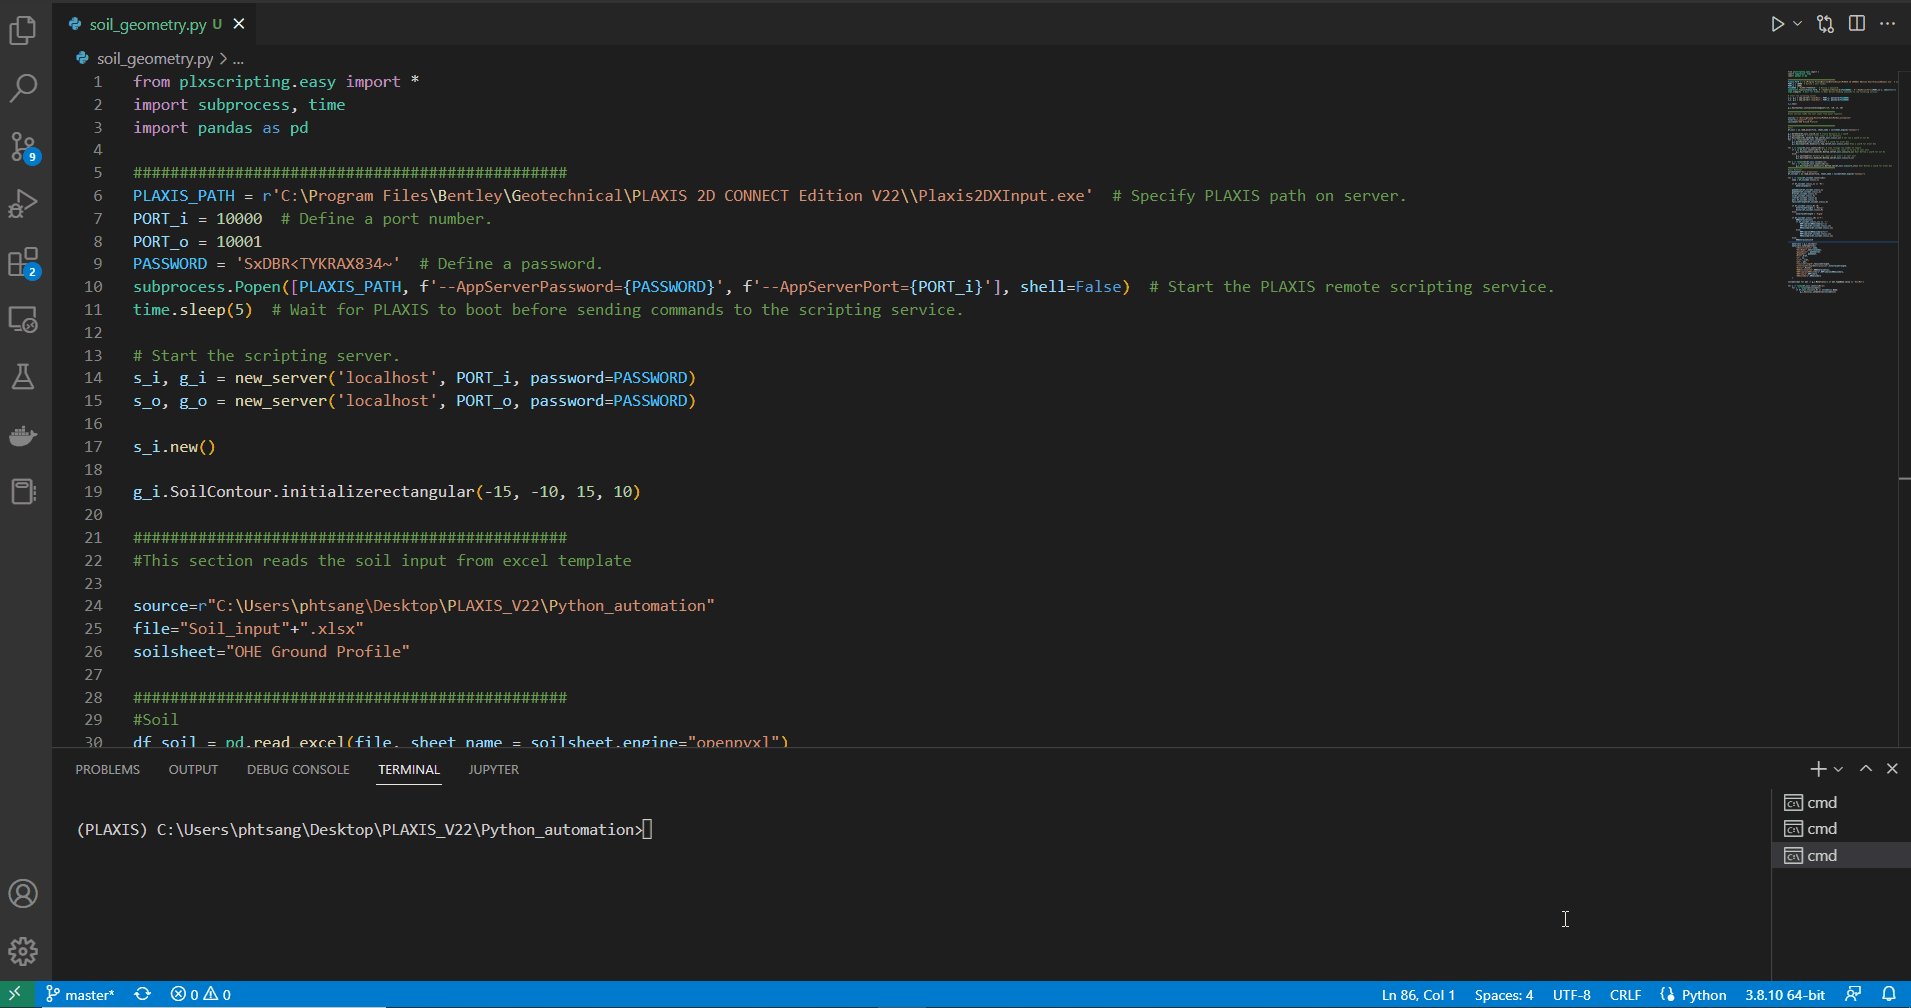
1from plxscripting.easy import *
2import subprocess, time
3import pandas as pd
4
5###############################################
6PLAXIS_PATH = r'C:\Program Files\Bentley\Geotechnical\PLAXIS 2D CONNECT Edition V22\\Plaxis2DXInput.exe'  # Specify PLAXIS path on server.
7PORT_i = 10000  # Define a port number.
8PORT_o = 10001
9PASSWORD = 'SxDBR<TYKRAX834~'  # Define a password.
10subprocess.Popen([PLAXIS_PATH, f'--AppServerPassword={PASSWORD}', f'--AppServerPort={PORT_i}'], shell=False)  # Start the PLAXIS remote scripting service.
11time.sleep(5)  # Wait for PLAXIS to boot before sending commands to the scripting service.
12
13# Start the scripting server.
14s_i, g_i = new_server('localhost', PORT_i, password=PASSWORD)
15s_o, g_o = new_server('localhost', PORT_o, password=PASSWORD)
16
17s_i.new()
18
19g_i.SoilContour.initializerectangular(-15, -10, 15, 10)
##Read Excel File
File location: C:\Users\phtsang\Desktop\PLAXIS_V22\Python_automation
File name: spreadsheet we created earlier which is “Soil_input.xlsx”
Since we want to extract values from “OHE Ground Profile”, we will use “pd.read_excel()” and specify the worksheet we want to read using “sheet_name”.
1source=r"C:\Users\phtsang\Desktop\PLAXIS_V22\Python_automation"
2file="Soil_input"+".xlsx"
3soilsheet="OHE Ground Profile"
Once we have the Excel template set up, we can then use these values to create soil profile.
Step 2: Input soil depth with Excel and create soil profile
In Step 2, we will extract the borehole values from the “OHE Ground Profile” worksheet and create soil profile accordingly.
The information involved in the input table is shown below. We will need this to reference our code.
We will be using pandas‘s methods to extract values from Excel. Detailed explanation can be found in the blog PLAXIS output visualization using Python.
First, we need to extract values from “OHE Ground Profile” worksheet and stores as “df_soil”.
1#Soil
2df_soil = pd.read_excel(file, sheet_name = soilsheet,engine="openpyxl")
Then, we need to create the 1st borehole with the X coordinate from the “BH1” column (i.e. df_soil.iloc[0,1]). It should be noted that the first row is skipped from dataframe.
1g_i.borehole(df_soil.iloc[0,1]) # Create borehole at x coord
Create the first soil layer using PLAXIS command ‘g_i.soillayer(0)’
1g_i.soillayer(0) # Create first layer in 1st borehole
After that, we will set the top y coordinate of 1st borehole using the command as shown below.
Soillayers[0]: represents the first soil layer. Soillayers[1] will then represent the second layer etc.
Zones[0]: represents the 1st borehole.
Top.set: allows us to specify the top y coordinate of the soil unit. This only needs to be set once for the first layer as the following layers will automatically take the bottom y coordinate from previous layer as their top y coordinate (similar to what PLAXIS does).
1g_i.Soillayers[0].Zones[0].Top.set(df_soil.iloc[1,1]) # Set top y coord of 1st Bh
Next, we loop through other borehole columns (i.e. BH2–4) to (1) create boreholes with the given x coordinates and (2) set top y coordinates.
1for j in range(len(df_soil.columns)-2):
2    g_i.borehole(df_soil.iloc[0,j+2]) # X coord for other Bhs
3    g_i.Soillayers[0].Zones[j+1].Top.set(df_soil.iloc[1,j+2]) #Top y coord for other Bhs
Once we set the top coordinate of each borehole, we then loop through the rest of the layers and set the corresponding bottom coordinates for 1st borehole.
Here we need to check if the loop reaches the last layer. If we don’t reach the last layer, need to create a new layer using the command ‘g_i.soillayer(1)’, otherwise, don’t create a new layer.
1for i in range(df_soil.count()[0]-2): # Loop through the number of layers
2    if i == df_soil.count()[0]-3: # Don't create new layer if we are at last unit
3        g_i.Soillayers[i].Zones[0].Bottom.set(df_soil.iloc[i+2,1]) #Set bottom y coord for 1st Bh
4    else:
5        g_i.soillayer(1) #Create new layer if we aren't at last unit
6        g_i.Soillayers[i].Zones[0].Bottom.set(df_soil.iloc[i+2,1])
Lastly, we loop through the rest of the boreholes except 1st borehole and set the bottom coordinates with the following code.
1for j in range(len(df_soil.columns)-2):
2    for i in range(df_soil.count()[0]-2):
3        g_i.Soillayers[i].Zones[j+1].Bottom.set(df_soil.iloc[i+2,j+2]) #Set bottom y coord for other Bhs
The final script should be as follow:
1df_soil = pd.read_excel(file, sheet_name = soilsheet,engine="openpyxl")
2
3g_i.borehole(df_soil.iloc[0,1])
4g_i.soillayer(0)
5g_i.Soillayers[0].Zones[0].Top.set(df_soil.iloc[1,1])
6for j in range(len(df_soil.columns)-2):
7    g_i.borehole(df_soil.iloc[0,j+2])
8    g_i.Soillayers[0].Zones[j+1].Top.set(df_soil.iloc[1,j+2])
9
10for i in range(df_soil.count()[0]-2):
11    if i == df_soil.count()[0]-3:
12        g_i.Soillayers[i].Zones[0].Bottom.set(df_soil.iloc[i+2,1])
13    else:
14        g_i.soillayer(1)
15        g_i.Soillayers[i].Zones[0].Bottom.set(df_soil.iloc[i+2,1])
16
17for j in range(len(df_soil.columns)-2):
18    for i in range(df_soil.count()[0]-2):
19        g_i.Soillayers[i].Zones[j+1].Bottom.set(df_soil.iloc[i+2,j+2])
Once the soil profile is created, we can then define the soil properties for each soil unit.
Step 3: Input soil properties with Excel and assign material
In Step 3, we aim to extract the soi properties from the “Soil properties” worksheet and assign these properties to the layer object (i.e. “SZ”, “SSIV” etc) we specified in column A in the previous section.
The information involved in the input table is shown below.
- Similar to the previous step, we first read the values from “Soil properties” and store them as data frame.
1soilmatsheet="Soil properties"
2df_soilmat = pd.read_excel(file, sheet_name = soilmatsheet,engine="openpyxl")
-
The typical soil properties for Mohr-Coulomb model are mentioned under “Excel Input Interface”. We will loop through the rows in the table and use iloc to find each value and assign them to corresponding variables.
-
To access soil models in PLAXIS using Python, numerical value should be used which is in the order displayed in PLAXIS. For example, the “Linear Elastic” model is represented by 1 and the “Mohr-Coulomb” model is represented by 2, and so forth and so on.
1for i in range(df_soilmat.count()[0]):
2    name = df_soilmat.iloc[i,1]
3
4    if df_soilmat.iloc[i,2] == 'MC':
5        materialmodel=2
6
7    gammaUnsat=df_soilmat.iloc[i,3]
8    gammaSat=df_soilmat.iloc[i,3]
9    Eref=df_soilmat.iloc[i,4]
10    nu=df_soilmat.iloc[i,5]
11    cref=df_soilmat.iloc[i,6]
12    phi= df_soilmat.iloc[i,7]
13    TensileStrength=df_soilmat.iloc[i,8]
- Then, we will assign an interface strength ratio if a value is given in the Excel template. To do this, we need to assign “Manual” as a string to ‘InterfaceStrength’ and the given ratio to ‘Rinter’. If no value is provided, “Rigid” will be assigned to ‘InterfaceStrength’ automatically.
1if df_soilmat.iloc[i,9] >0:
2        InterfaceStrength = 'Manual'
3        Rinter=df_soilmat.iloc[i,9]
4    else:
5        InterfaceStrength = 'Rigid'
-
Last component of the soil properties is the K0 condition. We need to decide if the K0 determination is “Manual” or “Automatic”. In PLAXIS-Python environment, “Automatic” and “Manual” are represented by 0 and 1 respectively.
-
We will also need to check if K0x = K0y based on user input. The checked and unchecked box of “K0x = K0y” are represented by True and False in Python respectively.
1  if df_soilmat.iloc[i,10] =='F':
2        K0Determination=1
3        if df_soilmat.iloc[i,11] == 'T':
4            K0PrimaryIsK0Secondary=True
5            K0Primary=df_soilmat.iloc[i,12]
6            K0Secondary=df_soilmat.iloc[i,12]
7        else:
8            K0PrimaryIsK0Secondary=False
9            K0Primary=df_soilmat.iloc[i,12]
10            K0Secondary=df_soilmat.iloc[i,13]
11    else:
12        K0Determination=0
- Then, use PLAXIS command ‘setproperties()’ to set material properties, similar to the 4th tutorial.
1    material1 = g_i.soilmat()
2    material1.setproperties(
3        "Identification",name,
4        "SoilModel",materialmodel,
5        "gammaUnsat", gammaUnsat,
6        "gammaSat", gammaSat,
7        "Eref",Eref,
8        "nu", nu,
9        "cref", cref,
10        "phi", phi,
11        "TensileStrength",TensileStrength,
12        "InterfaceStrengthDetermination",InterfaceStrength,
13        "Rinter",Rinter,
14        "K0Determination",K0Determination,
15        "K0PrimaryIsK0Secondary",K0PrimaryIsK0Secondary,
16        "K0Primary",K0Primary,
17        "K0Secondary",K0Secondary
18    )
- After that, we store the soil material as objects to ‘soilmat’.
1soilmat=[mat for mat in g_i.Materials[:] if mat.TypeName.value == 'SoilMat']
- Last step is to set material to the soil layer according to the “Name” column (i.e. column A) in the “OHE Ground Profile” worksheet. We will need to use if to check the material name provided in the table. If the name of the material matches the existing material object, assign that material to the soil layer using ‘Soils.setmaterial()’.
1for j in range(df_soil.count()[0]-2):
2    for i in range(len(soilmat)):
3        if df_soil.iloc[j+2,0] == soilmat[i].Name:
4            g_i.Soils[j].setmaterial(soilmat[i])
The final script is shown below:
1soilmatsheet="Soil properties"
2df_soilmat = pd.read_excel(file, sheet_name = soilmatsheet,engine="openpyxl")
3
4for i in range(df_soilmat.count()[0]):
5    name = df_soilmat.iloc[i,1]
6
7    if df_soilmat.iloc[i,2] == 'MC':
8        materialmodel=2
9
10
11    gammaUnsat=df_soilmat.iloc[i,3]
12    gammaSat=df_soilmat.iloc[i,3]
13    Eref=df_soilmat.iloc[i,4]
14    nu=df_soilmat.iloc[i,5]
15    cref=df_soilmat.iloc[i,6]
16    phi= df_soilmat.iloc[i,7]
17    TensileStrength=df_soilmat.iloc[i,8]
18
19    if df_soilmat.iloc[i,9] >0:
20        InterfaceStrength = 'Manual'
21        Rinter=df_soilmat.iloc[i,9]
22    else:
23        InterfaceStrength = 'Rigid'
24
25    if df_soilmat.iloc[i,10] =='F':
26        K0Determination=1
27        if df_soilmat.iloc[i,11] == 'T':
28            K0PrimaryIsK0Secondary=True
29            K0Primary=df_soilmat.iloc[i,12]
30            K0Secondary=df_soilmat.iloc[i,12]
31        else:
32            K0PrimaryIsK0Secondary=False
33            K0Primary=df_soilmat.iloc[i,12]
34            K0Secondary=df_soilmat.iloc[i,13]
35    else:
36        K0Determination=0
37
38    material1 = g_i.soilmat()
39    material1.setproperties(
40        "Identification",name,
41        "SoilModel",materialmodel,
42        "gammaUnsat", gammaUnsat,
43        "gammaSat", gammaSat,
44        "Eref",Eref,
45        "nu", nu,
46        "cref", cref,
47        "phi", phi,
48        "TensileStrength",TensileStrength,
49        "InterfaceStrengthDetermination",InterfaceStrength,
50        "Rinter",Rinter,
51        "K0Determination",K0Determination,
52        "K0PrimaryIsK0Secondary",K0PrimaryIsK0Secondary,
53        "K0Primary",K0Primary,
54        "K0Secondary",K0Secondary
55    )
56
57soilmat=[mat for mat in g_i.Materials[:] if mat.TypeName.value == 'SoilMat']
58
59for j in range(df_soil.count()[0]-2):
60    for i in range(len(soilmat)):
61        if df_soil.iloc[j+2,0] == soilmat[i].Name:
62            g_i.Soils[j].setmaterial(soilmat[i])
Run the script with the following:
1(PLAXIS) C:\Users\phtsang\Desktop\PLAXIS_V22\Python_automation>python soil_geometry.py
You should see the following is created in PLAXIS 2D. As you see from the soil windows, all boreholes have been created according the inputs from Excel.
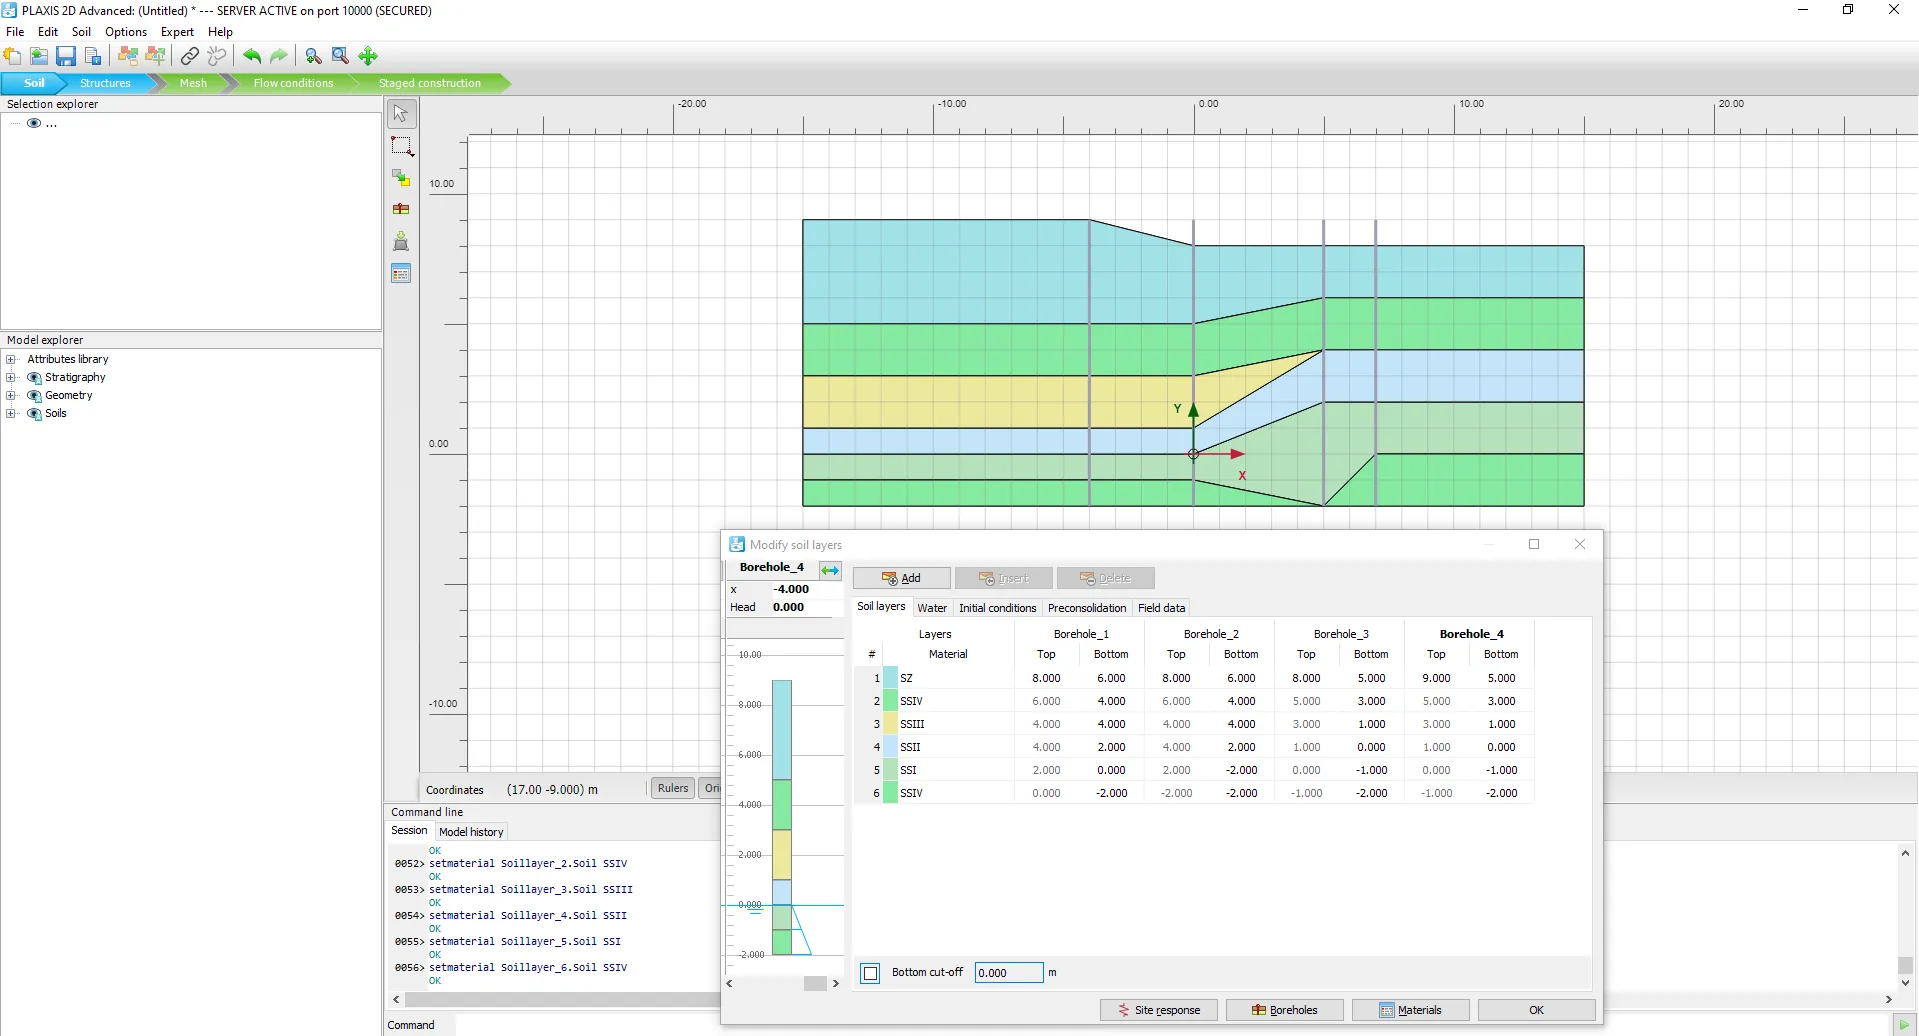
In terms of soil properties, all soil units have been created with the properties we specified in the input table.
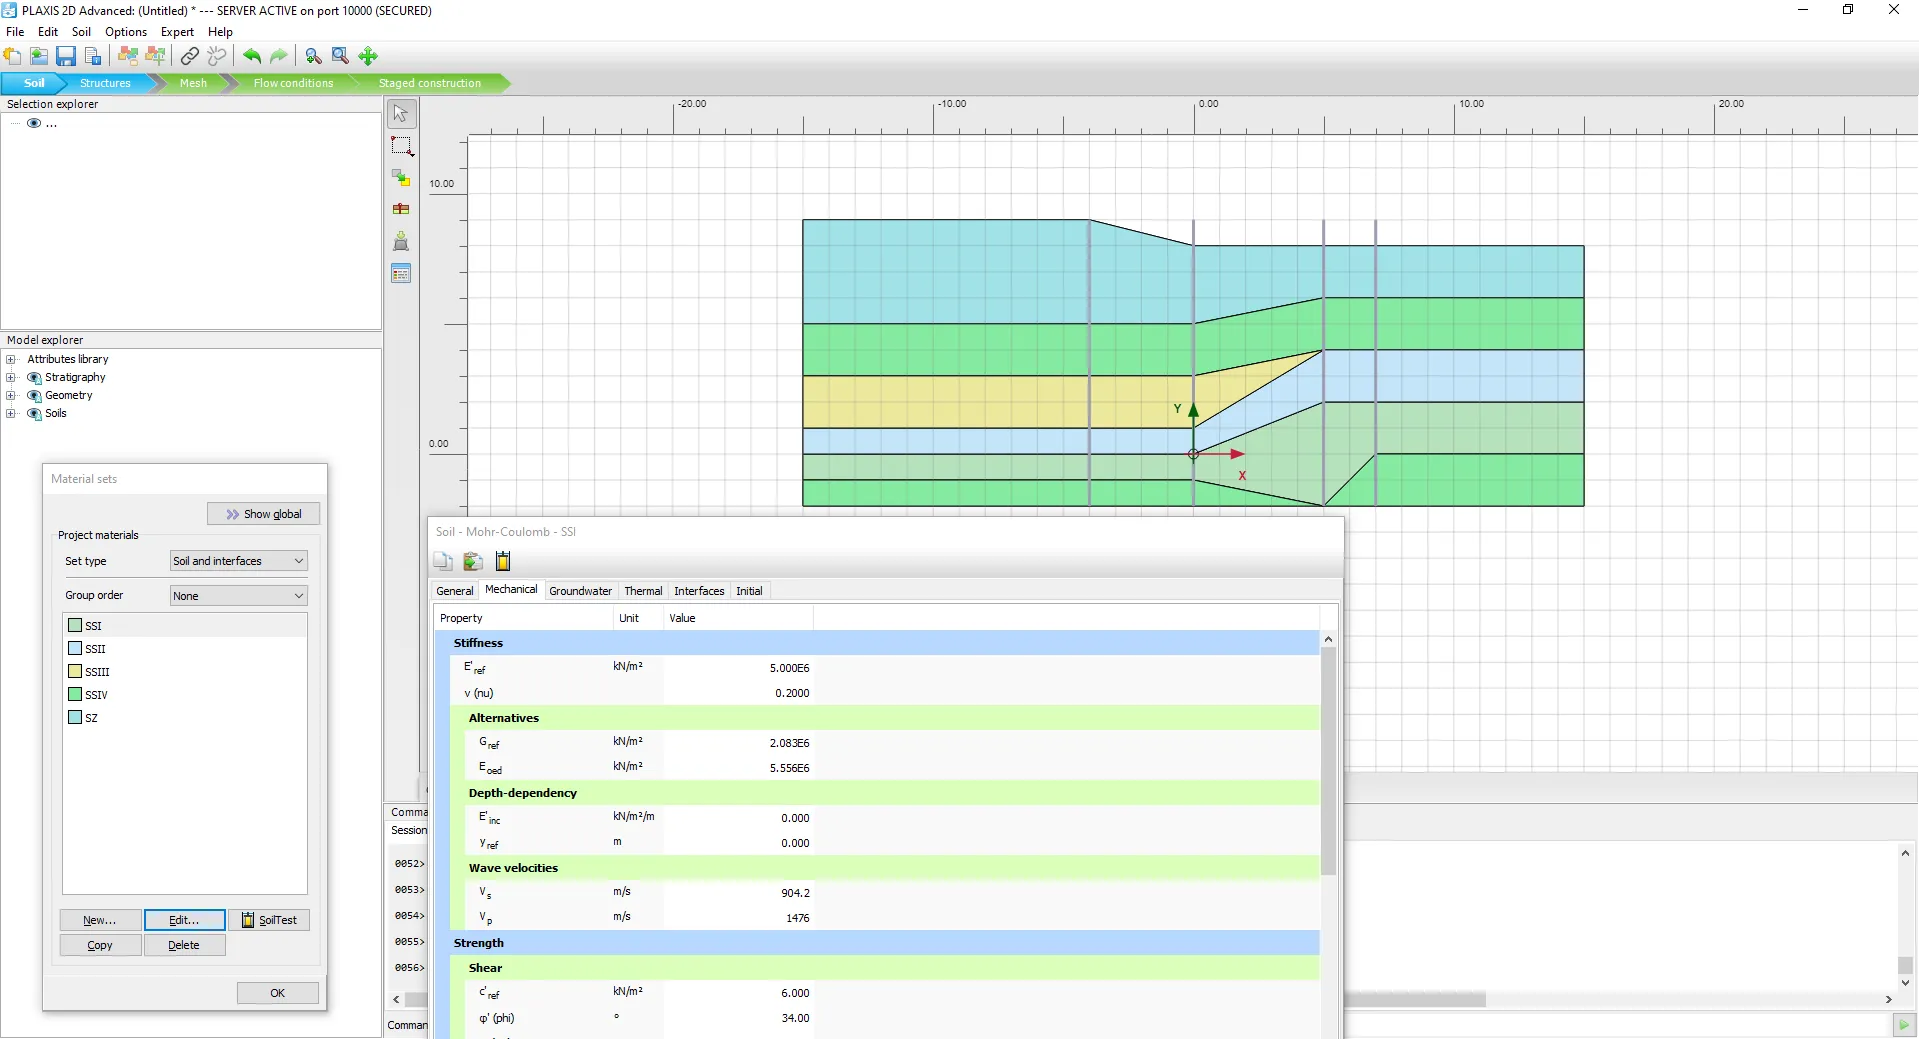
Brilliant! We have just created a soil profile with material definition using a user interface for PLAXIS 2D.
What's next?
That’s all for the fifth tutorial on creating soil profiles including material definitions using Python. After this tutorial, you should be able to obtain soil input from excel and create profile, as well as assign soil properties in PLAXIS.
Here you can find all tutorials to keep improving your automation skills:
Tutorial 1: Start Using Python to Automate PLAX
Tutorial 2: Extract PLAXIS results automatically using Python
Tutorial 3: PLAXIS result visualization using Python
Tutorial 4: Create a PLAXIS model based on a Excel sheet using Python
Tutorial 5: Can the AI chatbot ChatGPT do geotechnical engineering?
If you're interested in hearing more about Python, PLAXIS and workflow automation, feel free to follow my LinkedIn page. You can also support me by following me on Medium where I will provide source code and more general programming techniques in the future.

Start building apps now
Related Blog Posts


Get our best content in your inbox
Subscribe to our newsletter and get the latest industry insights