June 16, 2022
Visualize your data with Python and VIKTOR

by VIKTOR

Download the White Paper and get INSPIRED
Find how you can use AI automate engineering processes in your organization.
Turning data into valuable information
Due to the continuously growing amount of data, it is becoming more and more important for organizations to find ways to quickly extract useful information from large datasets. There are lots of software packages, Python libraries, and tools that you can use for this (think: Matlab, Excel, Numpy, Plotly, Matplotlib, Pandas). If you manage to make this complex data more accessible, usable, and understandable, you can not only obtain a lot of valuable insights, but also enhance decision-making, anticipate errors, compare results, and do much more to improve your organization’s performance.
The hard part often lies not with the extraction of information, but with the ability to make this information useful by, for example, visualizing it in the form of clear, effective, and interactive graphs, plots, tables, and infographics. For this, a user-friendly Graphical User Interface (GUI) is unmissable. And that is where VIKTOR comes into play.
Visualizing data with VIKTOR
VIKTOR provides a user-friendly user interface with a rich collection of Python digital building blocks that can be used to quickly create all kinds of interactive visualizations, using your preferred library (Matplotlib, Plotly). With a VIKTOR application, you can turn your data into understandable insights through an interactive and customizable dashboard.

In this article, we discuss how you can turn your data into valuable information with VIKTOR by integrating different Python libraries. The application shown in this article is a VIKTOR app that consists of four different pages, all doing something different with data.
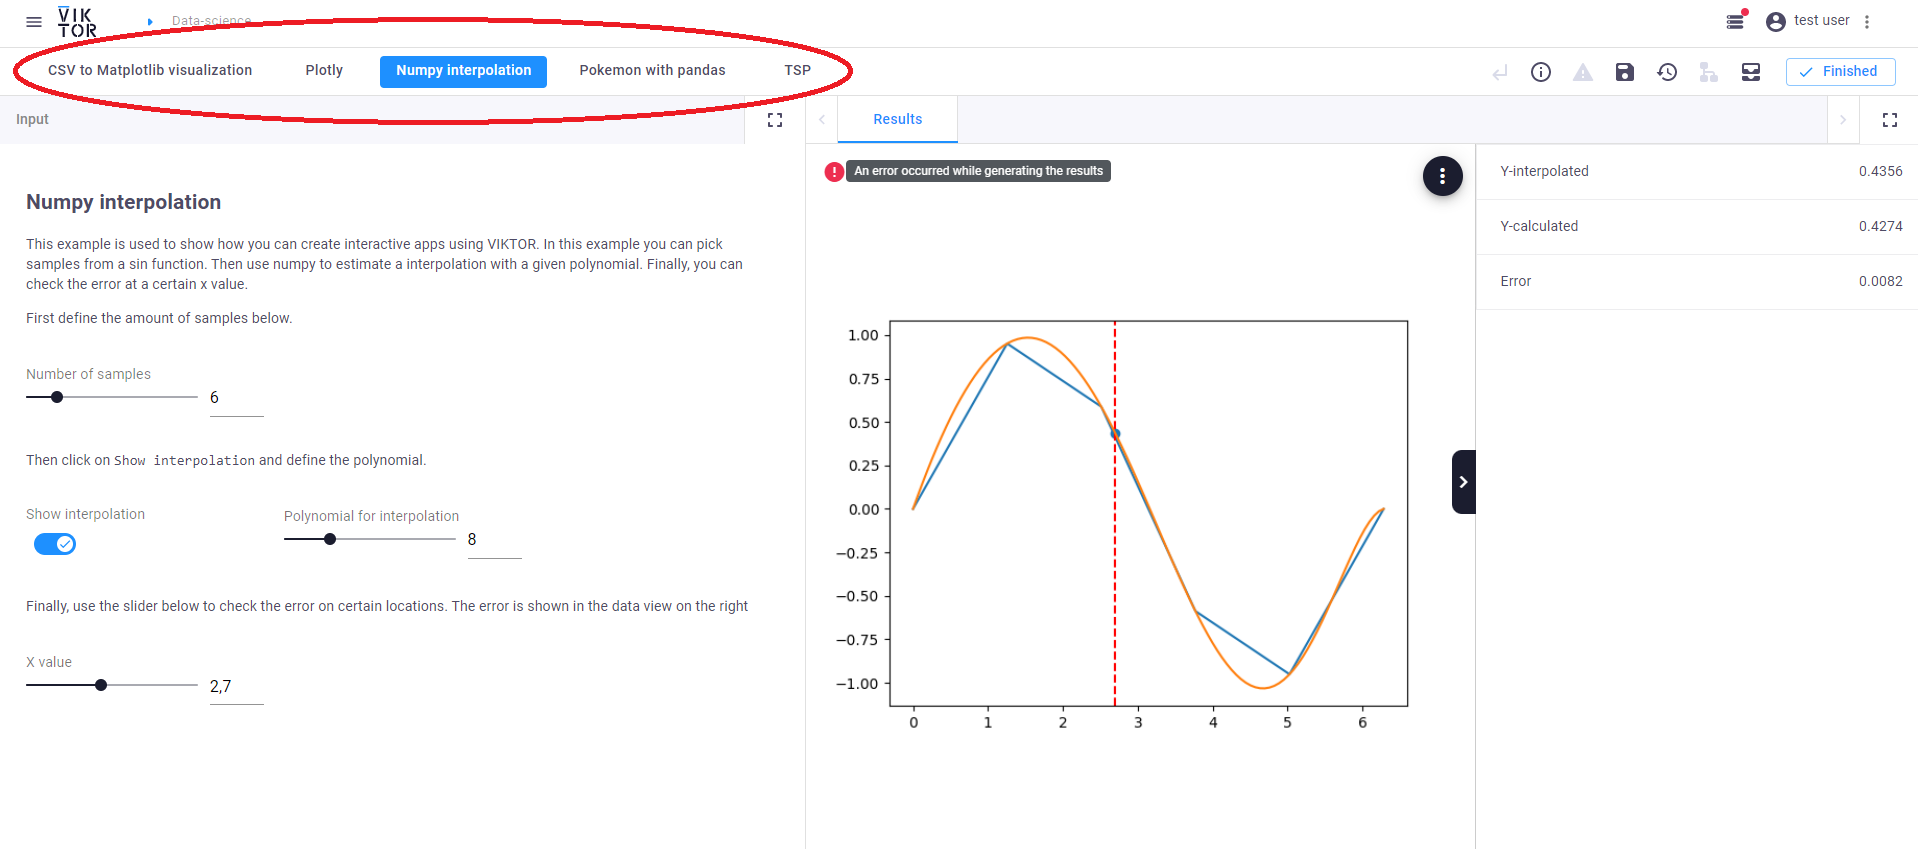
In the app, users can easily switch between the pages by clicking the corresponding tab in the top navigation:
- CSV to Matplotlib visualization
- Plotly
- NumPy interpolation
- Pokémon with Pandas
Build any application you can imagine
CSV to Matplotlib visualization
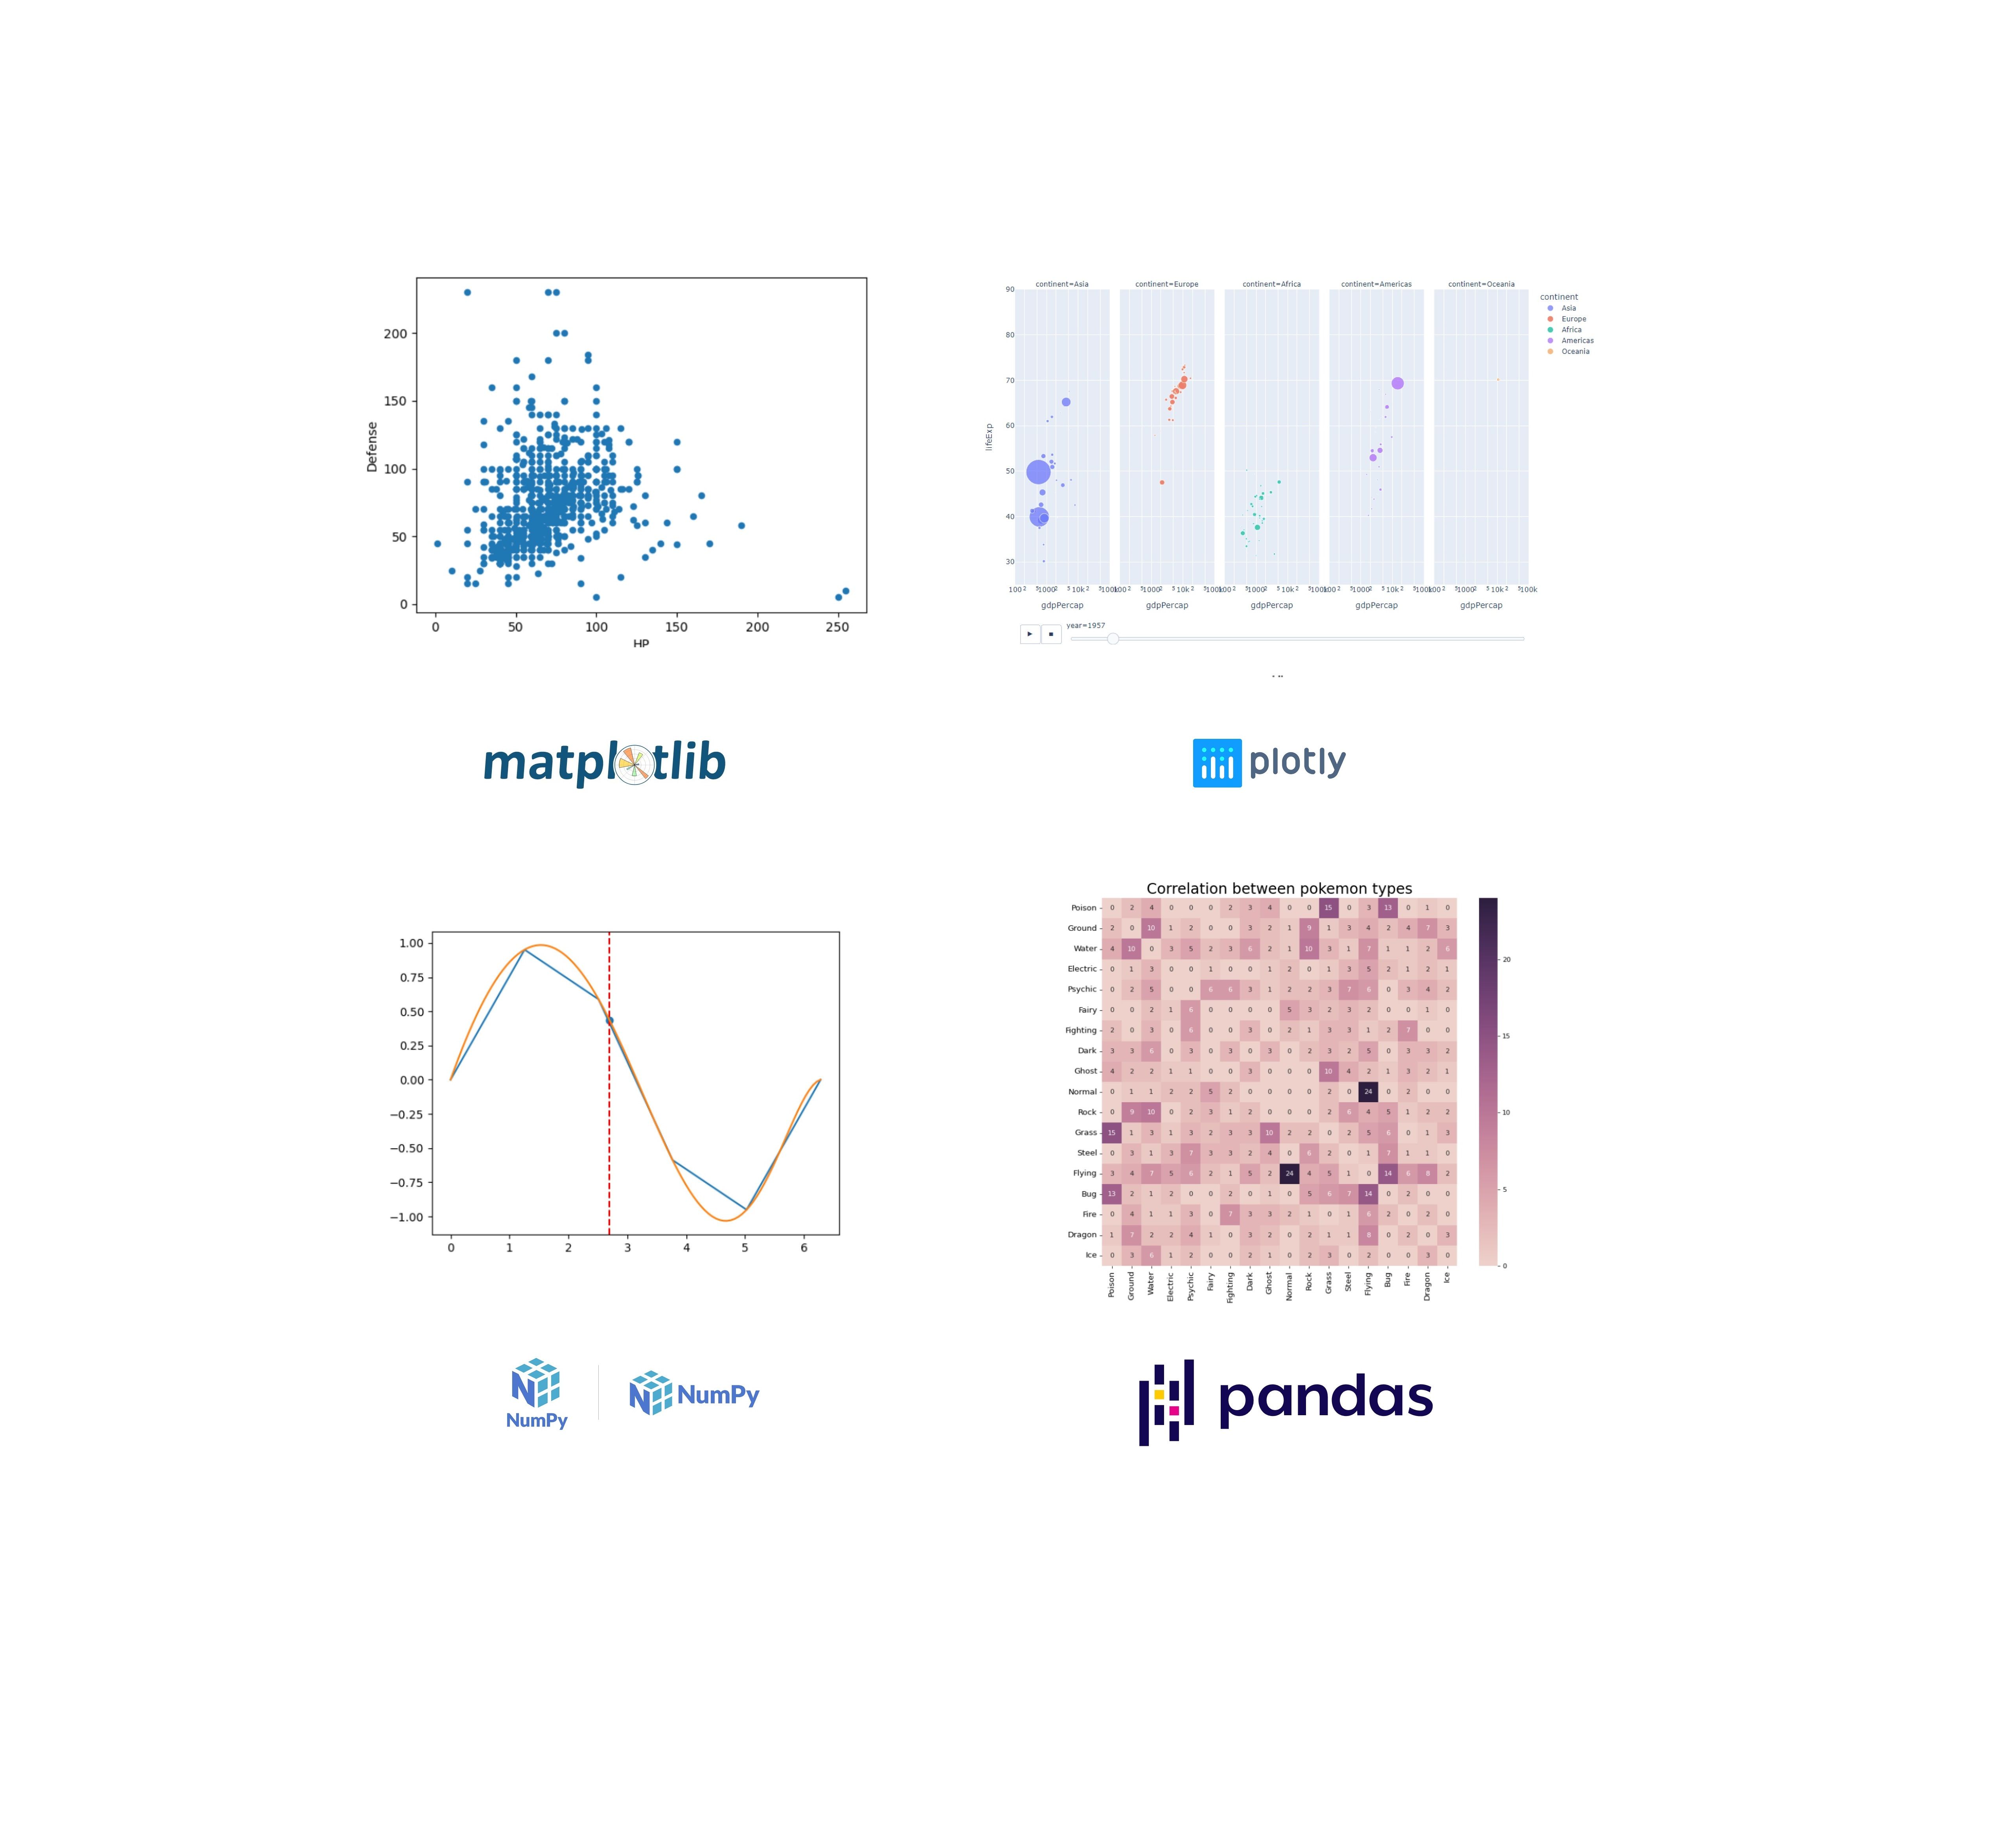
In this first page of the application, it is possible to upload CSV files to create Matplotlib visualizations. Matplotlib is an open-source plotting library for Python that can be used to create static, animated, and interactive visualizations.
In the application, users can download an example CSV file about Pokémons by pressing the dark grey button ‘Download CSV example’. You can find the Pokémon data here.
After uploading and selecting the desired CSV file, you can plot its data to a Matplotlib using the parameters ‘X axis’ and ‘Y axis’. After defining the parameters, VIKTOR automatically plots the data and visualizes it in the view on the right.
Here, you can see how the data from the CSV file is visualized in the scatterplot in VIKTOR with a few lines of Python code:
1try:
2	buffer = params.csv_page.file_link.file.open_binary()
3	df = pd.read_csv(buffer)
4	df.plot(kind='scatter', x=params.csv_page.options_x, y=params.csv_page.options_y)
5except ValueError as err:
6	raise UserException(err)
7
8buffer.close()
Plotly
With VIKTOR, it is super easy to use integrations with software like Plotly. Plotly is an open-source, browser-based data visualization library for Python. If you are looking for a way to build a clear and intuitive GUI for your data visualization, you can easily combine Plotly with VIKTOR in just 3 lines of Python code.
1@PlotlyView(''Results'', duration_gues=3)
2def plotly_visualization(self, params, **kwargs):
3	''''''Use the build-in gapminder dataset from plotly to create a plot. ''''''
4	dataframe = px.data.gapminder()
5	fig = px.scatter(dataframe, x=''gdpPercap'', y=''lifeExp'', animation_frame=''year'', animation_group=''country'', log_x=True, size_max=45, range_x=[100, 100000], range_y=25, 90])
6	return PlotlyResult(fig.to_json())
NumPy interpolation
This example shows how you can easily create interactive apps using NumPy and VIKTOR. NumPy is an open-source Python library that offers comprehensive mathematical functions, random number generators, linear algebra routines, and more.
In this example, users can pick samples form a sin function and use NumPy to estimate an interpolation with given polynomial and check the error at a certain X value. In the application, you can use the slider to first define the number of samples. Then users can select ‘show interpolation’ and use another slider to define the polynomial. Finally, by using a third slider, users can check the error on certain locations. The error is shown on the data view on the right side of the application.
Here you can see how NumPy is used to plot an interpolation with a given order polynomial in VIKTOR:
1# Interpolate over sinus curve
2polyfit = np.polyfit(x_value, np.sin(x_value), params.numpy_interp.polynomial)
3polyfit_function = np.poly1d(polyfit)
4y_interpolated = polyfit_function(params.numpy_interp.x)
Pokémon with Pandas
This last example shows how easy it is to manipulate data using a combination of Pandas and VIKTOR.
In this page, we use the same Pokémon database as in the first example (Matplotlib). Here, the Pandas open-source Python library is used to manipulate data by first removing all data-entries that are missing a value for its type. Then, VIKTOR automatically creates a correlation matrix that is used to plot a heatmap of the % of Pokémon that have two (or more) types.
The input field at the left side of the applications allows users to define the types they want to compare. By clicking on ‘select all’, a full plot can be generated after pressing the update button.
Here you can see how easy it is to read a CSV file with Pandas in VIKTOR:
1dataframe = pd.read_csv(Path(__file__).parent / 'datasets' / 'pokemon.csv').dropna()
Open-source Python code
If these examples sparked your interest, there are two ways in which you can use them yourself:
- By downloading the open-source code from the VIKTOR GitHub repository and integrating it with your own Python code. You can find the entire code here.
- By requesting an account for the VIKTOR demo environment. The demo environment offers a collection of 'sample' applications like this that you can use to better understand VIKTOR or as inspiration for your own VIKTOR applications. You can request an account for the demo environment here.
Would you like to build VIKTOR applications instead? No problem! Request a free VIKTOR account here.

Start building apps now
Conclusion
Data science adds value to a business on all kind of aspects. It is only important that an organization has the tools to use their data well. To maximize the value of your data, it is crucial that you are able to interpret the extracted information clearly. By visualizing your data by means of interactive graphs, tables, and dashboards, you can communicate your findings and make them usable and understandable to anyone.
VIKTOR is an application development platform that enables people to rapidly build their own applications with a Python Software Development Kit (SDK) with digital buildings blocks that can be used to create all kinds of interactive visualizations, using your preferred Python library. With a VIKTOR app, you can interpret data quick and easy by means of understandable insights, provided on an interactive and customizable dashboard which enables you to turn your knowledge into assets!