Download the white paper and get INSPIRED
Learn how collaborative parametric design models allow you to work together for better solutions.
This blog entry was written by BESIX
In this blog, the proposed automation strategy for the ongoing design process of the tunnel and its benefit during the detailed design phase compared to traditional methods will be discussed. The present project forms the first application of parametric design and automation of such magnitude being developed in-house at the BESIX Engineering Department. It reflects our ambition to use these techniques for tackling the ever increasing challenges within the construction industry and simultaneously boosting productivity and the quality of the final product.
Programming for construction engineering
When encumbered by the limitations of existing software packages, engineering tasks can greatly benefit from customized and automated workflows enabled by custom tools. Though not new, the implementation of programming in construction engineering is rapidly rising. The demand grows due to the ever increasing requirements and complexity of construction projects. In parallel the possibilities increase due to growing computation power, improved availability of Application Programming Interfaces (API’s) and to the rise of visual programming environments that are supported by large online communities, such as Grasshopper or Dynamo.
Parametric design and automation
About two years ago the in-house Engineering Department of BESIX –Belgium’s largest construction firm– started to explore the potential of parametric design and automation to enhance engineering activities.
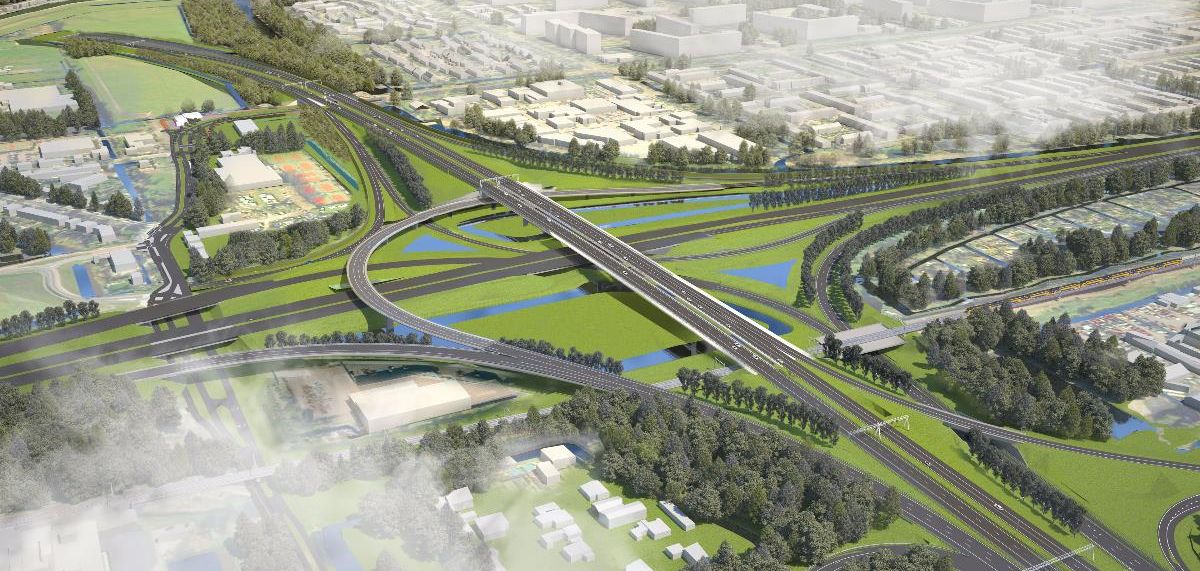
Parametric design for a new highway connection
BESIX is part of joint venture De Groene Boog that will design and construct a new highway connection in the North of Rotterdam for Dutch agency Rijkswaterstaat. The project comprises a 2.2 km long tunnel (excluding its entry ramps) of which the BESIX Engineering Department is currently conducting the structural design. Given the fact that repetition is key to ensure a large positive impact (both in terms of efficiency and quality) of any automation strategy, this tunnel design has from the start proven to be an ideal candidate to benefit from automation: it is a linear project with very repetitive geometry described by straightforward logic. In addition, a preliminary and detailed design phase of more than a year was foreseen, creating a risk for various design changes throughout the process that require rework. The project offered a unique opportunity for new developments thanks to this sufficient availability of time and to the high enthusiasm of all involved parties within the consortium for testing novel techniques. It forms the largest application of parametric design and automation developed inhouse at our engineering department so far.
The scope of automation for the tunnel design at BESIX comprises three parts:
- the construction of a 3D Building Information Model (BIM);
- the extraction of 2D technical drawings from this model;
- structural calculations of the piles and tunnel section.
A parametric information model
For purposes of coordination, visualization and communication a Building Information Model (BIM) of the tunnel’s structure needed to be created. This model is in a later phase used as the single source for the extraction of technical drawings.
To benefit from the high degree of repetition, we decided to create the model through a series of custom programmes or scripts built upon and interconnecting multiple existing software applications. The model is composed of parametric objects of which the parameters easily allow their geometry to adapt to the variations present in the tunnel. The scripts automatically place and update these objects together with their parameters and other information. The location of each object is computed from the central road axis (see picture below), which is delivered by an external party. Consequently, a change in road axis can swiftly be propagated to the entire BIM.
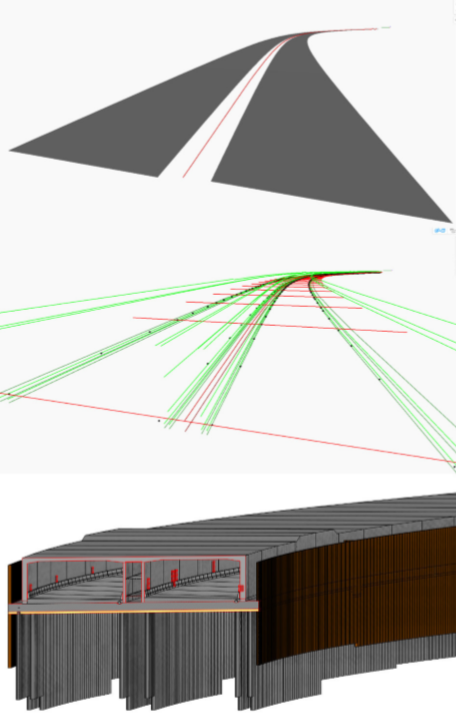
Three steps in the automated creation of the BIM: external input, i.e. the road axis and top surfaces with cross fall (top); main lines of the linear geometry (middle); view from the resulting structural model (bottom); screenshots from Dynamo and Revit.
Spreadsheets
The key parameters that together with the road axis drive the geometry of the model are gathered and managed using a set of spreadsheets. These spreadsheets offer the advantages of ease of use and centralization. They simultaneously serve as the interface between the multiple software packages –each selected for its specific strengths– comprising the automation workflow. From this information, each corner of the linear structural components of the tunnel could accurately be computed. The resulting coordinates are stored into a new spreadsheet that forms the basis upon which the entire model is further constructed. Subsequent tools stepwise populate these numerous coordinates with the parametric objects of walls, floors, piles etc. Due to the vast number of coordinates and objects, the custom developed scripts are no longer merely handy, but become indispensable to ensure that this process can be done in an efficient and accurate manner. The entire workflow is illustrated at the end of the blog.
A custom tool
It is important to note that various specialized commercial software packages exist for the modelling of linear infrastructure projects based on one or more road axes and a parametric road or tunnel profile. The coordinates of each corner of each linear structural component can furthermore easily be extracted from these models. The development of a custom tool for this purpose was nevertheless necessitated by the specific segmented tunnel geometry of the present project. The existing software typically creates geometry by sweeping a vertical profile along the road axis. Hence horizontal dimensions are measured normal to the road axis. In contrast, the present project consists of 25m long tunnel segments comprising straight walls, where horizontal dimensions should be measured perpendicular to the walls. A mismatch hence exists at places where the road alignment is bent. Though the difference might be small and mostly fall within construction tolerances, for the detailed design phase (with a minimum requirement of LOD300) we have nevertheless chosen to create a model that accurately corresponds to the design.
Designing the tunnel
Workflow automation
Developing the automation workflow for the creation of the parametric BIM of the tunnel has proven to be a time-consuming act. Multiple iterations of trial and error were required to find a workflow that offers sufficient flexibility to include all design variations throughout the process from model setup to drawing production. Consequently, an initial manual creation of the model within the existing software applications will probably have been faster. Nevertheless, multiple design changes have already taken place throughout the design process that likely have shifted the balance. The lessons learnt will additionally lead to faster developments on future linear construction projects.
Accuracy, less errors, and flexibility
Apart from time spent or won, the custom workflow improves accuracy and reduces risk of errors during manual actions. Most importantly is the gain in flexibility. Indeed, even a drastic change such as altering the road axis can now be quite efficiently dealt with by rerunning the various scripts. Nevertheless, the adaptability enabled by the developed tools is not infinite, but confined to a predefined design scope. It is important to consider which design changes should be allowed and included at the start of the modelling process, as changes surpassing the foreseen logic are more difficult to incorporate. The reality of a design project of this magnitude has unfortunately proven that this foresight is not always possible, making some rework inevitable.
Automated drawings
From the information model over 2000 of similar, yet not quite identical 2D drawings need to be extracted. This equals one unique set of drawings for each of the 89 tunnel segments. Automation is imperative to ensure an efficient production process and should furthermore ease the handling of late design changes.
Modern BIM tools greatly facilitate the extraction of drawings from a 3D model. The drawings are views from the 3D model, meaning that a change in the model is directly reflected in any related drawing. Nevertheless, setting up these drawings requires numerous manual actions. The average drawing sheet can easily take up to 8 hours for an experienced draftsman to complete. We have therefore opted to first create a single unique set of drawings of the tunnel to be approved within the project team, which would then serve as an example to be replicated as well as possible through automated procedures.
Our previous experiences have shown that due to repetitive work connected to drawing production greatly gains in time, standardization and accuracy can be made using custom tools with a short development time, reducing a draftsman’s work from an average of 8 hours to 1 hour per drawing sheet. Our goal for the present project is to further minimize the manual post-processing needed by draftsmen and to entirely eliminate this need for 80% of the drawings.
In a first step we automatically produce and manage the creation of drawing sheets and title blocks from a spreadsheet. The spreadsheet containing all drawing sheet information that is needed as input for this automated production is in general readily available for planning purposes. It can hence be efficiently reused for the actual creation of the drawing sheets. During the process, non-textual information can be added to the drawing sheets as well, e.g. QR codes providing a link to the online data management system.
Views and scripts
Once the drawing sheets have been prepared, views are created in the model and arranged on the drawing sheets. This process is straightforward to automate when the arrangement has been well considered in advance. Creating scripts to add dimensions to the 2D drawings has in contrast proven to be elaborate. In search for a generic approach to place context-specific annotation, we have opted to add coded markers to the parametric model objects (inspired by the work of jointventure-partner Mobilis on project RijnlandRoute). Instead of directly dimensioning the objects, their markers are dimensioned, where each marker represents one point in space. The form of annotation is managed in the marker codes, which group points to be added to the same dimension line and define this line’s orientation and relative position. For example markers with a similar code for property X will be added to a linear dimension line for all views oriented along direction Y. Annotation can hence be managed and customized within the modelling environment instead of the scripting environment. Since we have more modellers available than programmers, this is a beneficial feature.
Promising tests
Though the actual results are due later this year and the drawing automation workflow is still under development, first tests are promising. Numerous drawing sheets and views can be produced in no time and in a highly standardized manner. Full automation has not yet been reached for any drawing set, where particularly the post-processing of annotation remains crucial. We will continue extending the automated actions where the BIM application’s API makes it possible and the potential time gain versus the required development time of the scripts makes it sensible to do so. For indeed, full automation of all drawings will surely not be useful as most unique technical details will simply be more efficient to produce manually using the standard toolset provided by the BIM application.
Design automation
The present project equally entails repetitive work for the structural design of the tunnel that could be improved through automation. Several small tools are developed in-house to facilitate geotechnical analysis of the foundation and sheet piles. For the design of the reinforced concrete tunnel structure a tool has been developed together with an external partner on a Cloud-based platform (VIKTOR).
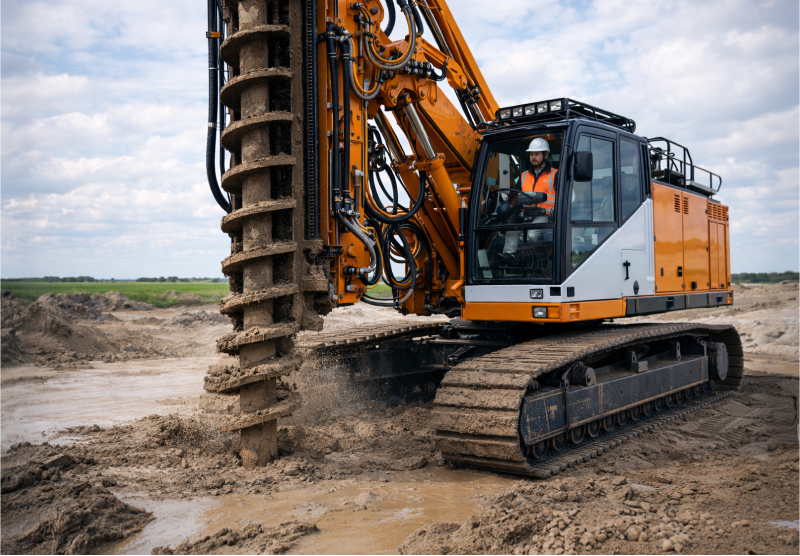
Geotechnical design
Over 6000 foundation piles and 4000 sheet piles are to be designed for the tunnel. First, hundreds of CPT measurements need to be interpreted and matched to the piles for calculation. A spreadsheet has been set up for a custom interpretation of the CPT measurements and a VBA routine to run this process in batch.
For the calculation of the piles, the tools typically used in the Dutch market are straightforward to use, though they do not allow to create parametric calculation models. To avoid the need to manually change the model input for each unique set of soil and loading conditions along the tunnel, we created another spreadsheet to mimic parametric behaviour. The desired parameters of each individual calculation model are assembled in a single spreadsheet. As the calculation model can be easily read and edited through a text editor, we then use string manipulation to edit the textual contents of the model and create a unique calculation model for each unique set of parameters. These are in a following step computed in batch and the results automatically gathered – again in a spreadsheet– for post-processing.
Structural design
For the structural design of the concrete floors, walls and roofs, we have collaborated with an external partner from the Netherlands, VIKTOR. Together we have developed a tailored design tool on their cloud-based platform by combining our engineering expertise with their development skills. This tool in a first step assists in setting up the structural models along the entire length of the tunnel for two different structural analysis software packages: a first to compute the internal forces of the tunnel sections and a second to design the structural reinforcement. The models are defined parametrically to easily set and change the design, while varying loads due to a variable tunnel depth are automatically introduced. The tool subsequently enables batch calculating all models and, most interestingly, afterwards gathers the results from both structural analysis packages and overlays them in a single visual representation (Figure 2). Aside from simply reducing the manual work, the tool hence processes and presents information in new manners providing swift insight for better-informed design decisions.
Quicker calculations
To assist the geotechnical design, several small tools have been developed in-house based on spreadsheets. These tools are a typical example of a short development time combined with rapid results and great time savings. Of course spreadsheets have long been widely used in engineering. It is important to be aware of their added strength once they are connected to external files and applications.
For the design of the tunnel’s reinforced concrete structure, the developed Cloud-based VIKTOR application drastically speeds up the calculation process and thus allows a change in design approach. Where one would traditionally calculate only a handful of representative tunnel sections, this tool allows calculating hundreds within the same time frame. The tool is hence beneficial to achieve higher precision results and improved insight, which enable fine-tuning the design and reducing material costs.
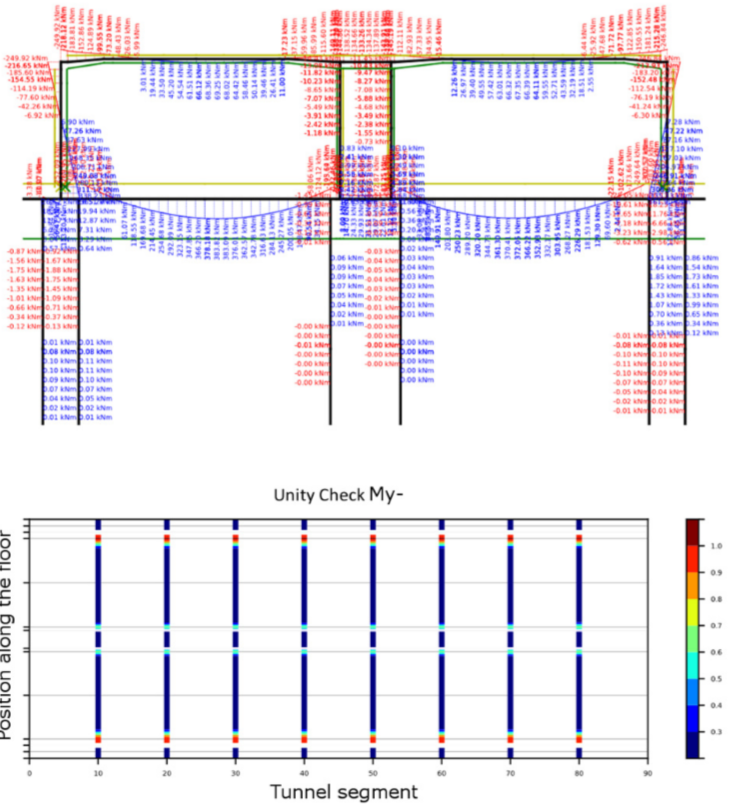 Visual output of the custom application based on the Viktor platform: single cross-section with bending moments (blue and red) and unity checks (yellow/green lines) (top figure); contour plot visualizing the unity check of the floor along the entire tunnel (results for 8 different segments are shown; bottom figure).
Technical or organizational challenge?
Due to its straightforward, repetitive geometry and its scale, the presented tunnel project offered various opportunities to develop customized tools for automation. Simple and accessible tools such as spreadsheets often play an important role, particularly as interface between existing software applications for an improved interoperability. The interactions between the individual workflows and tools could be further improved (e.g. by using the same centrally-stored geometric parameters for all applications; flowchart below). The variety of actors, information requirements, responsibilities and schedules however make this an organizational challenge rather than a technical challenge.
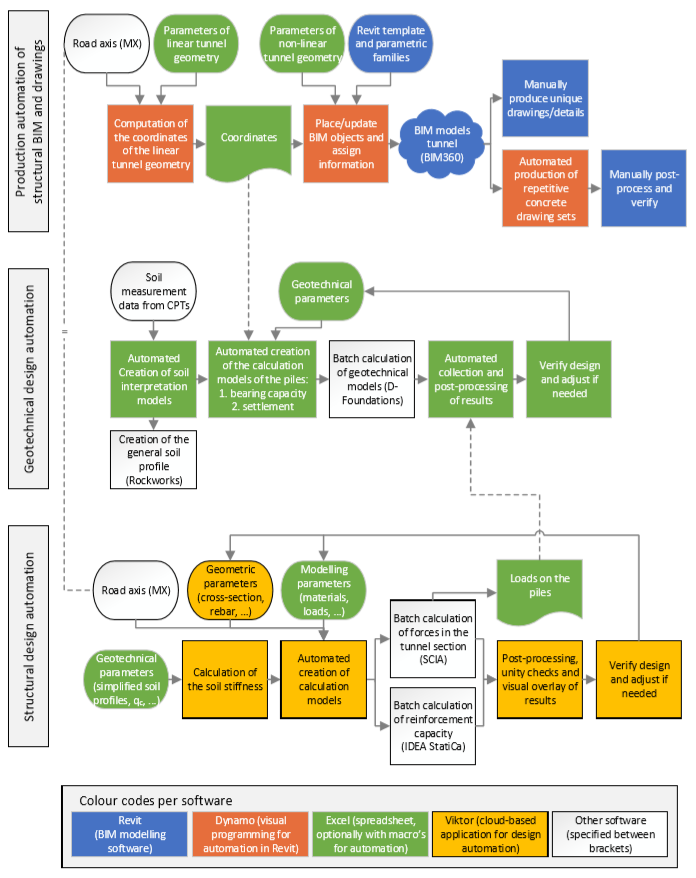 Flowchart of the automation workflows discussed in the present paper. The road axis is input shared by all workflows. Other input parameters -such as dimensions of the tunnel geometry- are of course equally shared, though they are entered in different formats and at different locations due to the varying information requirements. The dynamic links between the workflows should be improved in future projects.
Deciding automation
Developing the automated setup of the information model has taken longer than expected, largely due to the incorporation of exceptions on the overall geometrical logic. It should hence always be carefully considered whether these exceptions should be automated in the first place. Once the effort has been made, a huge flexibility for coping with design changes is nevertheless obtained. The various developments for drawing production and geotechnical calculations moreover demonstrated the potential of small tools to have a large profitable effect on time, effort, accuracy and standardisation.
Our enthusiasm about the added value of parametric design and automation is high and likewise are our ambitions for the present project. Multiple developments are still ongoing and several tools still need to be tested. Their true added value remains to be evaluated to maximally benefit from the present developments in future projects.
See how you can apply parametric design solutions to your projects too.
References
“Parametrisch ontwerpen,” Cement: vakblak over betonconstructies, vol. 70, no. 6, pp 4-55, 2018. Level Of Development (LOD) Specification Part I & Commentary, BIM Forum, 2019, available on https://bimforum.org/lod/
K. Roovers and F. Snoeck, “Parametric Design and Automation for Contracting,” in Proceedings of the IASS Symposium 2018, C. Mueller and S. Adriaenssens, Eds. Boston: MIT, 2018.
Bron: 2019 IABSE congress New York City