We will create 2 applications using the App Builder, to show you how easy it is to convert your Excel applications to shareable web applications, we will create 2 applications using the App Builder (our engineering AI agent) that will allow you to:
-
Calculate the interaction diagram for a column: We will use a spreadsheet that calculates the capacity of a column to support axial and bending loads, complying with American Concrete Institute (ACI) 318-19 to ensure your columns are safe and code-compliant. We'll convert this to a web application with reporting, interactive visualization, and a nice UI.
-
Generate a response spectrum plot: This is one of the most commonly used spreadsheets in structural engineering firms. We'll use an Excel file that generates the design response spectrum following ASCE 7 (American Society of Civil Engineers) guidelines, so you can properly estimate the seismic loads on your structure and meet code requirements.
Let's start!
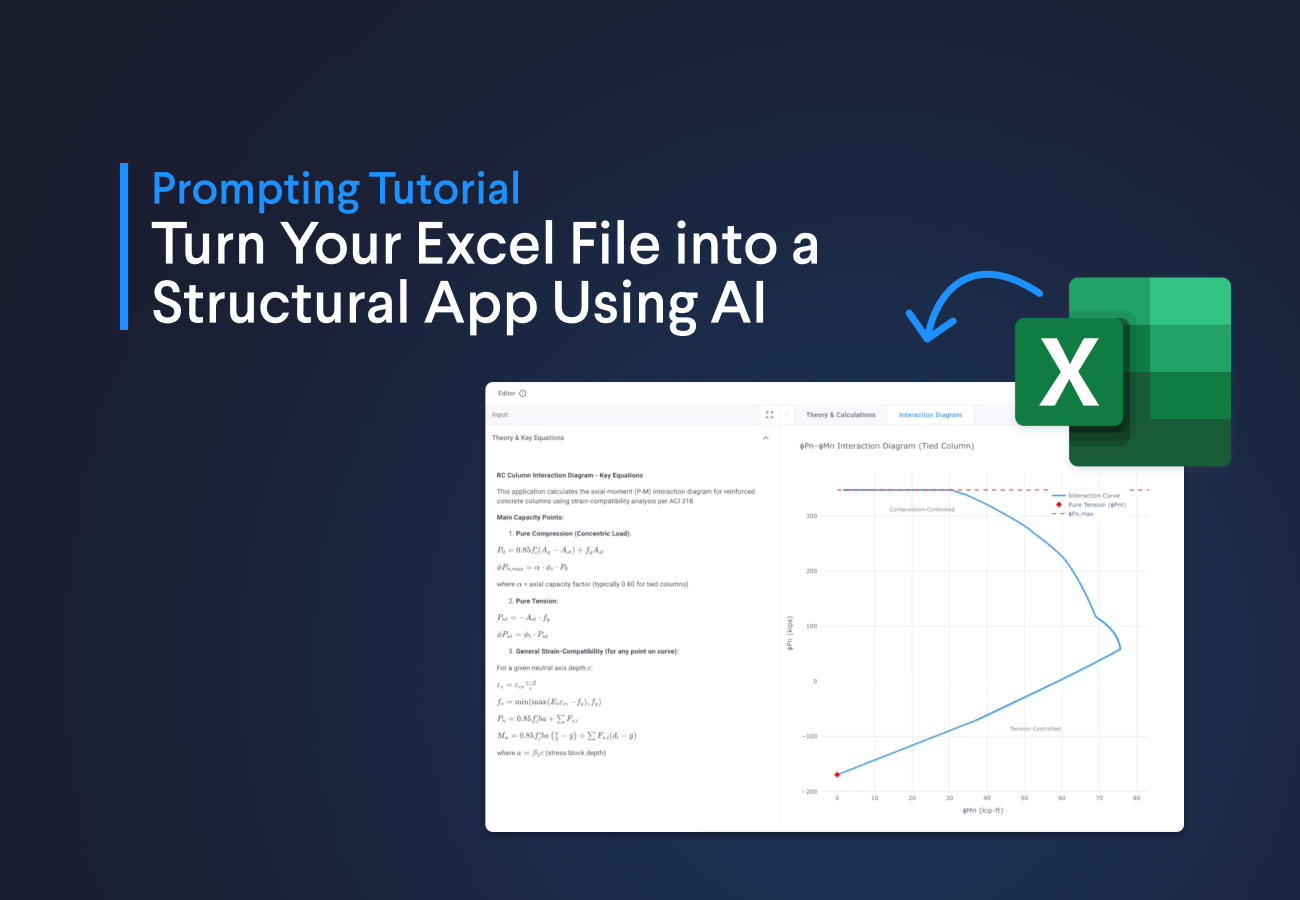
Application 1: Calculate the interaction diagram for a column
Interaction diagrams are essential for ensuring that columns in your structure are safe to resist combined axial and bending loads. This is the most common check when designing reinforced concrete columns.
Personally, I find it tricky to create this type of spreadsheet because you need to set up multiple rows with iteration tables across many rows and columns, and extending the analysis is quite difficult. However, if we use Python inside a web application, we eliminate these complex iteration tables and gain interactive visualization capabilities.
By converting to a web app, you also ensure version control, everyone accesses the same approved calculation through a shared link, and you unlock integration possibilities like automatic report generation and connections to your FEA package.
To create the application, you will do the following:
- Launch an instance of the app builder and explain what we're going to do
- Download the following Excel file
- Run a second prompt attaching the Excel sheet so the app builder can process it
- Extend the application with additional features
Describe what you want to build: column interaction diagram
To get started, run the prompt below. The app builder will use this to understand what you're trying to build before you share your Excel file. This two-step approach ensures the AI properly interprets your spreadsheet logic.

Excel Column Interaction App (ACI 318)
Create the application logic based on an Excel file: column interaction diagram
Now download the following Excel file and attach it in the app builder along with the following prompt. You can either drag and drop the file in the chat or click the attachment icon in the bottom right of the input box.
1
2I just attached the Excel file. Use the current inputs of the Excel as default values. I'll use this to validate the results of the application. Make sure the interaction diagram is complete so the last point will be pure tension and highlight this point.
3
Extend the application
Now that you have a working application, let's take it further. The prompts below will help you verify that the logic matches your Excel file and add detailed reporting. Feel free to experiment with your own prompts to customize it for your workflow.
Add application logic to the input parameters
One prompt I personally like when creating apps in the app builder is to add the equations the app is using in the first section of the app. You can run the following prompt to do so:
1
2Add the main equations for the main points of the column interaction diagram, with factors and assumptions in the first section of the application. Render the equations using LaTeX so they are readable inside a vkt.Text(), and make sure not to use indentation inside the VIKTOR Text docstring to ensure they render correctly.
3
Render a complete report with the main findings
To integrate the report and logic of your application in the same location, you can use the following prompt:
1
2Create a webview that displays the equations used in the app rendered in MathJax, add intermediate step calculations and summarize the main points of the interaction diagram.
3
Application 2: Generate a response spectrum plot
Response spectra are graphs that show how much a building will shake during an earthquake based on its natural period of vibration. They're essential for estimating seismic forces on your structure and are one of the most frequently used calculations in structural engineering practice, following ASCE 7 guidelines.
I use these plots to input seismic parameters into my finite element software like ETABS or SAP2000, or to perform hand calculations using the Equivalent Lateral Force (ELF) method to estimate how much seismic load each floor of my building needs to resist.
To create the application, you will do the following:
- Launch an instance of the app builder and explain what we're going to do
- Download the following Excel file
- Run a second prompt attaching the Excel sheet so the app builder can process it
- Extend the application with additional features
Describe what you want to build: response spectrum
Just like before, we'll start by giving the app builder context about what we're building. Run the prompt below to set the stage before attaching your Excel file:
Excel Response Spectrum App (ASCE 7)
Create the application logic based on an Excel file: response spectrum
Now download the following Excel file and attach it in the app builder along with the following prompt. You can either drag and drop the file in the chat or click the attachment icon in the bottom right of the input box.
1
2I just attached the Excel file. Use the current inputs of the Excel as default values. I'll use this to validate the results of the application. Generate 2 views: one for the response spectrum and the other for estimating the seismic loads. Create a dynamic array that captures the inputs of the Equivalent Lateral Force (ELF) method.
3
Extend the application by exporting the results
Most structural engineers need to export seismic data to their FEA software. The prompt below will add download buttons that generate CSV files compatible with ETABS, SAP2000, or STAAD, plus detailed calculation reports:
1
2Create two download buttons:
3
41. A download button to download the detailed calculation of the seismic loads (lateral equivalent forces) in a PDF
52. A download button that generates a CSV file with the points of the spectrum
6
Conclusion
In this blog, you learned how to convert your Excel spreadsheets into fully functional web applications using the App Builder. We covered how to transform a column interaction diagram and a response spectrum calculator from Excel into shareable web apps with interactive visualizations and detailed reporting. This gives you a solid foundation to start automating your structural engineering calculations and saving time on repetitive tasks. If you'd like to share the app with your team or explore more advanced features, book a demo and a VIKTOR expert will be happy to help you get started.
Start building apps for free